S360 RELEASES EXCLUSIVE POLL ON SEATTLE HEAD TAX WITH KIRO 7 NEWS
POLL COMES BEFORE COUNCIL VOTE, SHOWS “STUNNING NUMBERS” THROUGHOUT SEATTLE
With the City of Seattle embroiled in a debate over the City Council’s proposed employee head tax plan, Strategies 360 teamed up with KIRO 7 News to find out how Seattle voters are responding.
The exclusive poll came as the first piece of publicly released opinion research into the issue that has dominated the city’s news cycle and produced what S360 Co-founder and CEO, Ron Dotzauer called some “stunning numbers.”
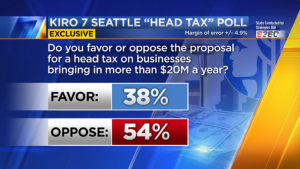
The survey found the proposal to charge Seattle businesses that earn more than $20 million a year with an employee head tax entirely underwater, with 54% of Seattle voters opposed to the plan, compared to 38% in support:

“This is a vote that Seattle doesn’t want,” Dotzauer told KIRO 7 News when analyzing the poll results. “The biggest surprise of this poll is the intensity of the opposition – usually you get a little more balance. Clearly, there are some very strong feelings about the head tax in Seattle.”
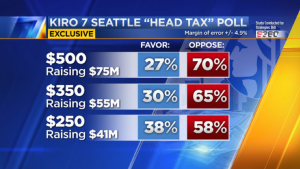
When asked at what dollar amount voters might support a head tax, the poll showed strong opposition across the board:

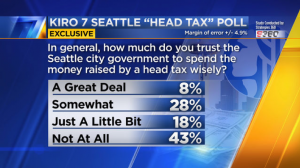
Compounding the clear public sentiment opposing a head tax in any form was a strong distrust of Seattle government to manage the money raised by a potential head tax wisely:

The live telephone poll of 400 registered voters in Seattle was released by KIRO 7 on Monday morning, ahead of the Seattle City Council’s full vote on the proposed $500-per-worker head tax on some Seattle businesses.
View the full survey results here, and read the full coverage and analysis by KIRO 7 here.
Statement on Methodology:
In partnership with KIRO 7 News, Strategies 360 conducted a survey among 400 registered voters in the city of Seattle. The survey was conducted by live professional interviewers between May 11th and 13th, 2018. A combination of landline and mobile phones were called to ensure greater coverage of the population sampled.
The margin of error for a survey of 400 interviews is ±4.9% at the 95% confidence interval. The margin of error is higher for subsamples. Other sources of error not accounted for by the stated statistical margin of error include, but are not limited to, question wording, question order, coverage bias, and response bias.
The sample for this survey was drawn randomly from a list of registered voters and stratified by Seattle City Council District. Quotas were assigned to reflect the actual contribution of these areas to the total electorate. The sample reflects the demographic composition of the Seattle electorate per data from the U.S. Census Bureau, King County Elections, and several distinct voter files.